See how Lean Analytics helps SaaS startups grow smarter with the right data at every stage.

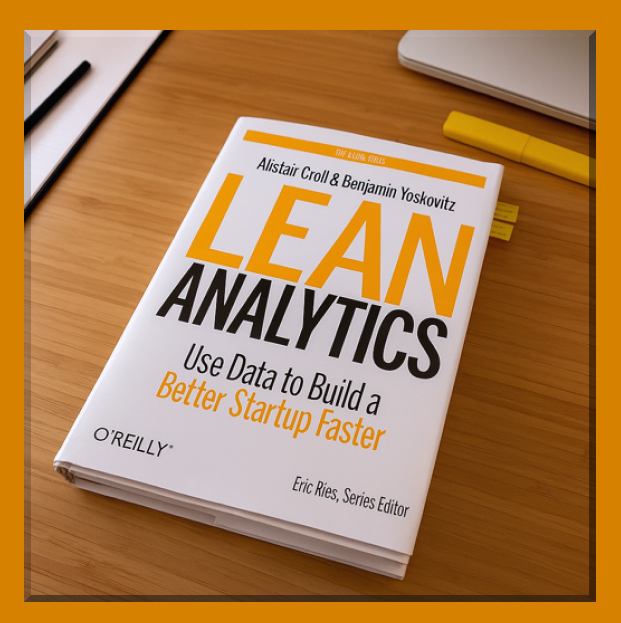
Imagine you’re the founder of an early-stage SaaS startup. You’ve built a cool product and even gotten a few hundred signups, but now growth has stalled. Marketing spend is rising and you feel lost in a sea of data — customer surveys, usage stats, revenue numbers — but don’t know which figures to focus on. This is a classic SaaS growth headache. Lean Analytics — a book by Alistair Croll and Ben Yoskovitz — offers a data-driven startup framework to solve exactly this. In one line: Lean Analytics teaches founders to focus on one key metric at a time to guide growth. It’s a founder-friendly, smart approach to using metrics to inform every stage of building a scalable SaaS strategy.
Lean Analytics & the One Metric That Matters
The core idea of Lean Analytics is that “at any given time, there’s only one metric you should care about above all else”. This One Metric That Matters (OMTM) forces focus: instead of getting lost in dozens of “vanity” stats, the team aligns on the single most important number for right now. For example, an early-stage SaaS might focus on activation rate or daily active users, whereas a later stage might focus on ARR growth rate or net revenue retention. This doesn’t mean other data aren’t tracked, but by picking one priority metric the team aligns its efforts and experiments. As Yoskovitz and Croll explain, founders often chase the shiny new thing (product features or channels), but Lean Analytics says it’s better to “run the risk of over-focusing (and miss some secondary metric) than to throw metrics at the wall and hope one sticks”. In practice, a data-driven startup will regularly revisit its OMTM as it progresses, switching focus as needed, but always communicating one clear goal to guide decisions.

Stage 1: Empathy — Understand Customers Before Scaling
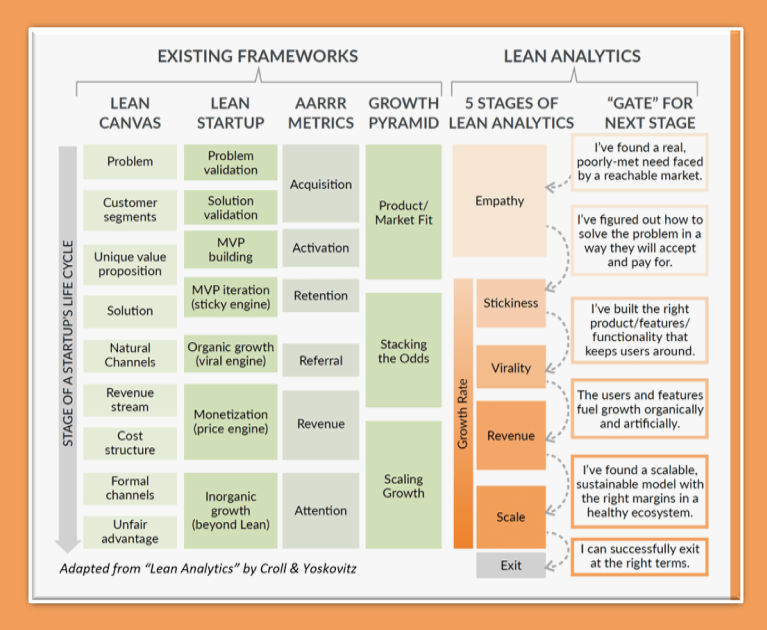
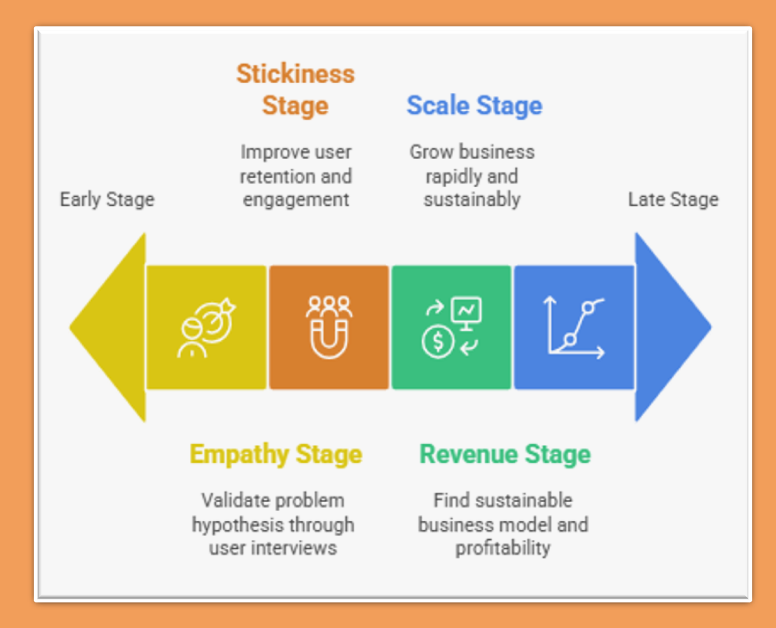
The first stage of Lean Analytics is Empathy — it’s all about really understanding your customers’ problem. Here your goal is qualitative: interviews, surveys, and customer discovery to validate that the problem you’re solving is painful and important enough. In this stage, your OMTM might be something like “number of problem interview completions” or “survey conversion rate” — metrics that reflect learning, not revenue. As one summary notes, the startup must ask: Is the problem painful? Do enough people care?. Actionable tips: do 15–30 in-depth user interviews using the Mom Test approach (ask concrete questions, avoid leading), and listen for real pain points. Watch for cues that users light up — a sharp intake of breath or repeated use of strong language means you’ve hit on something. Avoid building features yet. Only move on once you’ve identified a sufficiently large, underserved problem that customers would eagerly pay to solve.
Stage 2: Stickiness — Build a Product People Love (Retention First)
With a clear problem and early solution, the Stickiness stage is next. This is where you build the MVP and test if users come back. The central metric here is retention or engagement (how “sticky” the product is). Think of it as the first proof of product-market fit. Actionable tip: pick a cohort and measure how many of those users return after X days (week 1, 2, 3). The Lean Analytics authors suggest focusing on cohort stickiness — for SaaS this could be weekly active users or monthly renewal rate. Crucially, do not pump all your efforts into new acquisition yet (“optimizing a leaky bucket”). Instead, iterate to make the product as easy and valuable as possible. For example, find the fastest path to the “aha moment” — the moment a new user realizes your product’s value — and eliminate friction up to that point. Slack, for instance, made team chat so intuitive that new users often add teammates immediately (they “cajoled” friends to try it, fueling their early word-of-mouth). In summary, track retention, reduce churn, and prioritize improvements that keep your early adopters engaged before worrying about scale.
Stage 3: Virality — Fuel Organic SaaS Growth
Once the product is sticky, the Virality stage focuses on growing users efficiently. Here your OMTM might be a viral coefficient or a growth rate, and you optimize referral loops and other channels. Lean Analytics breaks virality into types: inherent (built into usage), artificial (incentivized), and word-of-mouth. For example, Dropbox famously used artificial virality: give both referrer and friend extra storage space, so each new user brings in another. The key metrics are the Viral Coefficient (how many new users each existing user creates) and Viral Cycle Time (how fast they invite). A viral coefficient above 1.0 (every user leading to more than one new user) means exponential growth. Actionable tips: implement a refer-a-friend program or sharing prompts inside the product. Measure how many invites each user sends and how many leads they convert into signups. Tweak incentives, email reminders, and onboarding to shorten the invite cycle. Even if you don’t have a built-in referral loop, invest in content, SEO, and social campaigns to acquire users with the mindset of being “good users” who will stick around. (For enterprise SaaS, use NPS surveys as a proxy for organic growth buzz.) Remember: without a viral or organic lift, paid acquisition will only cost you more.
Stage 4: Revenue — Optimize Your SaaS Engine and Unit Economics
At the Revenue stage, the question is: Is the money machine profitable? Here you start focusing on business metrics and sustainable growth. Lean Analytics uses a “penny machine” analogy: you put a dollar in sales & marketing, and aim to get more than a dollar (say $1.80) back. In SaaS terms, key metrics include LTV/CAC, Gross Margin, ARPU, and the Sales Efficiency Ratio ((ΔMRR / Sales+ Marketing spend). A handy rule from Lean Analytics is: (Current Quarter MRR – Previous Quarter MRR) ÷ Last Quarter’s S&M Spend should exceed 1. In other words, each dollar spent should return more than a dollar in revenue. If it’s below 0.75, it’s a red flag. Actionable tips: experiment with pricing and packaging to improve ARPU; double down on the most profitable acquisition channels; and systematically improve conversion funnel (website → trial → paid). Also focus on churn: increasing Net Dollar Retention (through upsells or adding features) directly fuels growth. Slack, for example, found that enterprise customers could be upsold to larger plans, boosting revenue per user. Ensure you measure time to breakeven on CAC (how quickly a customer’s revenue covers their acquisition cost) – the faster, the better. The goal is clear: a healthy SaaS needs to prove that its engine can turn spend into profit on a sustainable scale.
Stage 5: Scale — Expand and Systematize for Growth
In Scale, your product-market fit is proven and you’re fighting to expand market share. Lean Analytics notes that at this point, metrics shift to those of large companies. The startup now focuses on operational efficiency, team processes, and competitive strategy. Actionable tips: invest in data and automation to drive growth. For example, build dashboards to track Net Revenue Retention, Customer Success metrics, and monthly/quarterly growth trends. Expand into new segments or geographies, using analytics to validate each move. Consider the “Hole in the Middle” problem — make sure you’re neither too broad nor stuck between niches — by identifying clear strategic advantages (portals, partnerships, or unique features). Keep refining pricing (e.g. adding enterprise tiers or usage-based models) and monitor margin on every customer. Essentially, scale smartly by doubling down on what’s working (channels, products, regions) and using data to reduce waste in ops. The Lean approach here means even at scale you keep iterating: continue running rapid experiments on campaigns and features, but with larger budgets and stakes.
SaaS Case Study: Dropbox’s Viral Explosive GrowthDropbox provides a textbook example of Lean Analytics in action. Early on (2008–2010) Dropbox had solved a real pain (file syncing) but needed users. Instead of heavy advertising, they used an artificial virality strategy: users got 500MB free space for each referred friend, and the friend also got 500MB. The result was dramatic: Dropbox grew from 100,000 users to 4 million in just 15 months (a 3,900% increase!). This viral loop turned each new user into a mini-acquisition channel. Importantly, Dropbox ensured stickiness by making file-syncing easy (a built-in virality). As a metric, they likely focused on invitations per user and conversion of invites to signups (the viral coefficient). Later, in the Revenue stage, Dropbox optimized pricing and upsells (they launched paid plans as business use grew). By 2017, Dropbox had 33.9 million paying users and over $1B ARR. This case shows how focusing on the right metric (in this case the viral coefficient in the Virality stage) and engineering a growth hack propelled a startup.
Slack’s Team-Centric Viral Growth
Slack’s rise illustrates lean metrics through stickiness and virality. At launch in 2013, Slack “cajoled” a few teams to try it, and within 24 hours they had 8,000 new users, scaling to 50,000 in a few weeks. Word spread fast because Slack replaced clunky emails with instant chat — a highly sticky, daily tool for teams. Slack didn’t hire a traditional outbound sales team until years later; instead, product usage metrics drove growth. By mid-2018 Slack was tracking 8 million daily active users (3 million of whom were paying). They had 70,000 paid teams (clients), including 65% of the Fortune 100. At this point Slack’s OMTM was likely DAU or team adoption rate, reflecting engagement. Founders used freemium and seamless invites (one user adds coworkers with a click) as a viral loop. Through lean experimentation, Slack iterated on onboarding and integrations to boost retention. The end result: a $7B valuation pre-IPO. Slack’s journey underscores Lean Analytics: focus on early stickiness (daily team chat usage) then on virality (easy invites), and only later worry about monetization (enterprise sales). Today Slack’s success is leveraged by many as a scalable SaaS strategy — one driven by metrics, user feedback, and viral adoption rather than big marketing budgets.
Conclusion: Act Now — Build Your Data-Driven Growth Engine
Lean Analytics equips SaaS founders with a step-by-step, data-driven roadmap for growth. The key is discipline: at each stage (from empathy through scale), pick the right OMTM, measure it relentlessly, and run experiments to improve it. For example, an early-stage SaaS might start with interviews and a qualitative OMTM (“% of interviews confirming user pain”), then move to a retention metric, and eventually optimize LTV/CAC. The two case studies show that when Slack and Dropbox leaned hard on the right stage metrics (user engagement and referral rates), they grew exponentially without losing focus.

Practical Call-to-Action: SaaS marketers and founders should start by identifying their current Lean Analytics stage. Ask yourself: Do I really understand my customers’ problem (Empathy)? Is my product sticky enough to keep them (Stickiness)? Have I validated my growth channels (Virality)? Do my unit economics work (Revenue)? Then choose the corresponding One Metric That Matters and take action. Use cohort charts to track retention, implement a simple referral feature, or calculate your CAC payback. Iterate quickly based on data. By following the Lean Analytics framework — moving through Empathy, Stickiness, Virality, Revenue, and Scale — your SaaS can make smarter, data-driven decisions at every step. The payoff is a scalable SaaS strategy where growth is not a guess but a repeatable process. Start measuring what matters today, and grow smarter tomorrow.

I write SaaS content and book reviews for Medium, helping founders and teams grow smarter with actionable insights.

